Part 9: Hydrogen Dyscalculia
Series 1, previously published on LinkedIn January 10, 2023 (minor edits)

This series of articles concerns the ARUP+ domestic hydrogen risk assessment and the subsequent criticisms levelled against it. In Part 11, I started by commenting on some online discussions that maligned the report, and then in Part 22 discussed the factual errors plus, how and why the pursuit of domestic hydrogen had been misrepresented.
For the remaining Parts 3 to 11, the article published in Hydrogen Insight, ‘Is it safe to burn hydrogen in the home? Let’s look at the evidence’3 by Tom Baxter, has been used as an example of the type of influential rhetoric that I believe to be so dangerous, because typically, they are a product of an open relationship with facts.
I have already pointed out some serious errors in this article which led me to the uncomfortable conclusion that Mr Baxter, his colleagues at the Hydrogen Science Coalition and Hydrogen Insight are unaware or indifferent to the fact that N2O is not part of the NOx species. It was a relief to see that The Chemical Engineer trapped the chemical errors before publishing their version but the original article is never corrected4.
The endeavour has been to introduce some badly needed context for the scope, report boundaries and the scenario assumptions. You will no doubt know from experience that beyond engaging in contradiction, a single sentence of something you disagree with may take a paragraph to refute and in tackling misinformation that is a real problem.
In trying to rebalance the conversation with fairness and objectivity I have not always succeeded at being entirely dispassionate, but in my defence, these things matter.
Cooking Measures
As we continue to move through the article, Mr Baxter draws our attention to the kitchen scenario, as he writes:
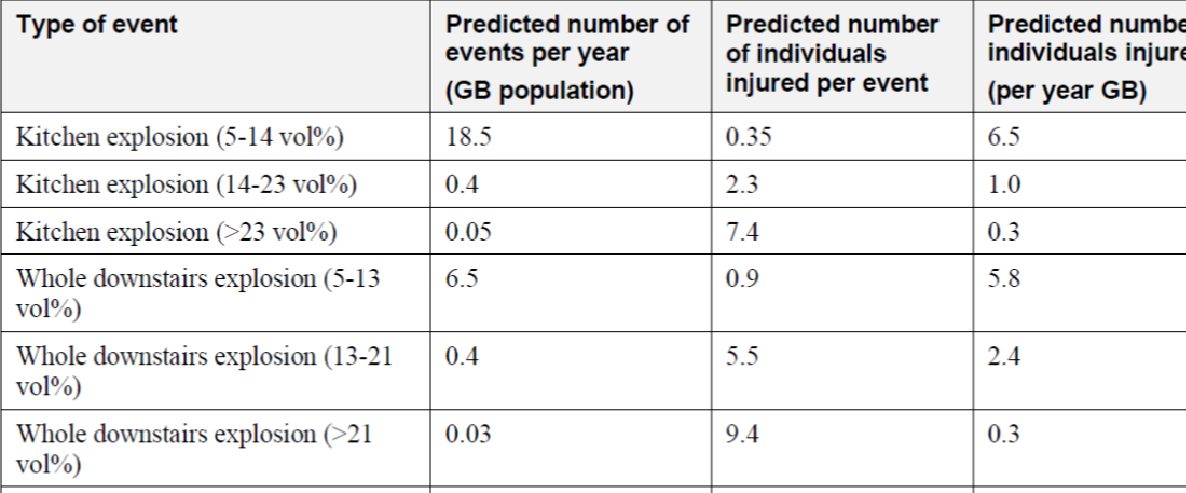
If you look only at the kitchen (a place where I spend much of my time), the frequency of an EFV-protected hydrogen explosion is 19 times a year across the UK, compared to six for natural gas.
And also;
The overall number of injuries in the EFV-protected kitchen is eight for hydrogen and six for natural gas. So the kitchen is now a less safe place.
‘Is it safe to burn hydrogen in the home? Let’s look at the evidence’ Hydrogen Insight, Tom Baxter
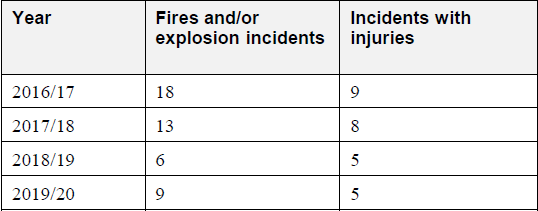
Let’s take these claims in reverse order. The difference between six and eight injuries (per year), is smaller than the annual variability of natural gas injuries, for three of the four years from 2016 to 2020. I made a similar case for fires and explosion incidents in Part 5, using the Table 28 reproduced once again below.
Safety Assessment Conclusions Report incorporating Quantitative Risk Assessment, Hy4Heat Workpack 7, ARUP+
Also with reference to the same table, the number of events over the same period has ranged from six to eighteen. So why has six been chosen as being representative of the number of natural gas incidents? Presumably it dropped out of the model but the more important point is not that it is questionable, but to keep the order of magnitudes and the scale of the variances in mind. I will revisit this when I serialise my own review of the ARUP+ QRA in March.
Suffice to mention for now that this should not be taken to mean that hydrogen will cause 25% more injuries overall because it is more representative to say it is 2 more injuries out of 67 million people.
Of course, were I to accept Mr Baxter’s interpretation that six natural gas incidents results in six injuries, whereas nineteen hydrogen events result in eight, I could make a persuasive case that hydrogen is safer. All it would take is for me to park my rationality and state that the likelihood of injury resulting from an hydrogen explosion is 42%, but the comparable likelihood for natural gas explosion is 100%. For reasons already given I would not make that mistake even though it would suit my purpose to do so.
I think it’s the anticipation of this point that causes Mr Baxter to tie himself up in knots:
Let’s extend that argument to two adjacent chemical plants — A and B. Modifications are made that means the individual risk in plant A increases but reduces in plant B. I work in plant A, do I believe that my increased risk is acceptable because other colleagues are safer?
‘Is it safe to burn hydrogen in the home? Let’s look at the evidence’ Hydrogen Insight, Tom Baxter
What argument is being extended here? What is this meant to be an analogy for? Why would two independent plants A and B be causally linked? The analogy does not expose absurdity but rather smuggles it in.
When watching a film or reading a novel, we have to immerse ourselves in the imaginary world, the internal logic of the story becomes a necessary assumption of enjoying the fiction. So, let’s temporarily suspend our disbelief to see if the above analogy can be re-framed, into something coherent.
Two terraced houses — A and B. An exorcism is performed in house B and the poltergeist passes through the party wall. I live in house A, do I believe the crockery flying around my kitchen is acceptable, because my neighbour is no longer haunted?
‘Stuff I just made up’, Michael Vigne
Now we have a causal link between A and B for as long as we allow ourselves to believe in the supernatural explanation (which is the ingredient Mr Baxter is missing).
As people equip themselves to make decisions about the technology they want in their lives, fiction is not a good foundation for understanding the options. Imagine my vicarious embarrassment when in a recent post Mr Baxter said:
To bring the injury rate down, two, in series excess flow valves (EFVs) are installed in the hydrogen circuit. The results are shown in Table 31 – kitchen injuries are now 7.8. That’s still 40% higher than natural gas.
Well let’s take a look at the Table 31.

What injury rate Mr Baxter is talking about? He has made an error but I am not sure which one it is. It is either a +0.4 typo when looking at volumes exceeding 23%, or running out of fingers when trying to add up all the kitchen incidents, either way it is important to establish we are talking about the same thing. There is an awful lot to unpack as the table may not be entirely clear and it is not the sort of detail that will be noticed by anyone scanning the table for the biggest numbers.
The table gives a kitchen per-incident injury rate of 7.4 for volumes >23%. We are told that these are mitigated by EFVs so this is the range of leakage they are intended to stop. However, if the mitigation fails, it seems it will be so rare an event that everyone in the house will crowd into the kitchen to witness it. I’ll come back to the number of people later, but if for now assume it is 7.4, what would that mean?
A rare incident where the EFV mitigation fails results in an accumulation of gas in the kitchen of >23% despite ventilation. This is so rare it only happens (next column) 0.3 times a year. So the averaged injury rate is 7.4 x 0.3 = 2.22 per year but of course, they don’t happen every year because typically, such an incident would happen once in three to four years.
This brings me back to the rationale for there being more injuries in the kitchen with hydrogen over natural gas. I understand that it stems from high conservatism, but I have to say, I question that too. The rate of injury is correlated to structural damage given that falling or collapsing masonry and projectiles are the main types of injury in a gas explosion. Why are more injuries predicted in the kitchen for hydrogen over natural gas for a given level of structural damage?
As I said in a previously:
Where does all the extra kitchen damage come from, or for that matter, extra people?
Part 6: The Framing of Hydrogen, LinkedIn, Michael Vigne5
The issues are more nuanced than I can elaborate on here but I will return to this when I serialise my own QRA review in March.
Part of the issue underlying the domestic hydrogen controversy, are the boundaries we put around a problem, because that determines how we define it. Blinded by the case Mr Baxter he makes against hydrogen, it seems he has failed to recognise the significance of the assumptions made, in the report he is meant to be reviewing.
In the penultimate Part 106 I will elaborate on some of these themes, emphasising that how a problem is constrained, defines the shape of the outcome and why it is important to know where those boundaries are.
Next - Part 10: The Scope of the Hydrogen QRA put link here and link back to LI via
7 Safety Assessment Conclusions Report incorporating Quantitative Risk Assessment, Hy4Heat Workpack 7, ARUP+
Part 1
Part 2
‘Is it safe to burn hydrogen in the home? Let’s look at the evidence’ Hydrogen Insight, Tom Baxter
Mr Baxter later confirmed that this addition was made by the editor of Hydrogen Insight as discussed here and here
Part 6: The Framing of Hydrogen, LinkedIn, Michael Vigne - put link here
Part 10: The Scope of the Hydrogen QRA


