


Part 6: The Framing of Hydrogen
Part 6: The Framing of Hydrogen
Series 1, previously published on LinkedIn January 10, 2023 (minor edits)


To recap on this series thus far, in Part 3 onwards, I have been discussing how hydrogen and its combustion was characterised by the Hydrogen Insight article, ‘Is it safe to burn hydrogen in the home? Let’s look at the evidence’ authored by Tom Baxter. The obvious aim of the article is to summarily dismiss the ARUP+ QRA report in order to claim that hydrogen cannot be used safely in the home. I argue that this position doesn’t proceed from the report’s results, instead, it’s the starting assumption that is unshakable by any amount of evidence to the contrary.
Domesticating Hydrogen
I am not uncritical of the ARUP+ QRA report and have some reservations that the study was over-conservative, but beyond pointing to many of the more obvious signs, I'll not give a detailed opinion on that here. There are a lot of moving parts to consider, and I will include a more detailed discussion on this in my review of the QRA, which will be serialised in March. For now, my tour through Mr Baxter’s review continues, with a look at the projections for incidents and injuries. The format for what follows, is that first, I will show you what Mr Baxter says about each item, before I offer my interpretation.
A Number of Burning Questions
Arup found that there would be many more fire and explosion events with hydrogen — 39 a year (across the UK population) compared to nine for natural gas. When taking into account the consequences of those event, it gave a predicted number of individuals injured annually of 65 for hydrogen, compared to 17 for natural gas.
‘Is it safe to burn hydrogen in the home? Let’s look at the evidence’ Hydrogen Insight, Tom Baxter
The ARUP+ QRA report results from a deliberately pessimistic assessment of hydrogen against an extremely optimistic baseline of natural gas. This much is stated in the text on multiple occasions, e.g.
This is an example of natural gas being assigned a cautious low risk to ensure a relative QRA with a pessimistic view of hydrogen
Note to Table 26: Combined injury results for natural gas, Safety Assessment Conclusions Report incorporating Quantitative Risk Assessment, Hy4Heat Workpack 7, ARUP+
I will be invoking this quotation in context later, suffice to mention now that although being conservative is good practice, as readers we still need to understand the assumptions to make sense of it. It is not simply a case of passing off numbers without any context or qualification. Ultimately, all the results of studies, tests and trials must be gathered together to inform decision making on domestic hydrogen policy and regulation.
For now I would like to explain why the prospect of safe domestic hydrogen is worthy of your consideration. I don't intend to critique the entire QRA here, but I do want to show you first, the extreme caution used and second, how this has been taken out of context by those who want to undermine the study. To that end I will walk you through some of the ARUP+ assumptions and show you to the relevant questions.
The Tables 24 and 25 correspond to ‘kitchen’ and ‘downstairs’ scenarios and both are extracted from the QRA report. The last two columns in each table, represent the concentrations of natural gas and hydrogen respectively, for a given level of potential structural damage. For the sake of disambiguation, this does not mean that those concentrations will necessarily result in an incident, just that they create the conditions that make such an event possible. When reading the term ‘damage potential’ it might be useful to remember my emphasis on the last word.
Table 24 - Kitchen Scenario: first observe the equivalence in damage potential (partial collapse of 3 houses) between the volumetric concentrations of natural gas (7.5-14.0%) and hydrogen (14.0-23.0%). Ignore the differential volumes between natural gas and hydrogen for now because it is not relevant, except to note, they represent the proportion of the total kitchen volume. Both probabilistically yield 2.0 injuries as a result of the likely damage.

Safety Assessment Conclusions Report incorporating Quantitative Risk Assessment, Hy4Heat Workpack 7, ARUP+
Table 25 - Downstairs Scenario: second, observe the equivalence in damage potential (total collapse of 3 houses) between the volumetric concentrations of natural gas (6.5-11.0%) and hydrogen (13.0-21.0%). These volumes are as a percentage of the total downstairs volume. Both probabilistically yield 5.4 injuries as a result of the likely damage.
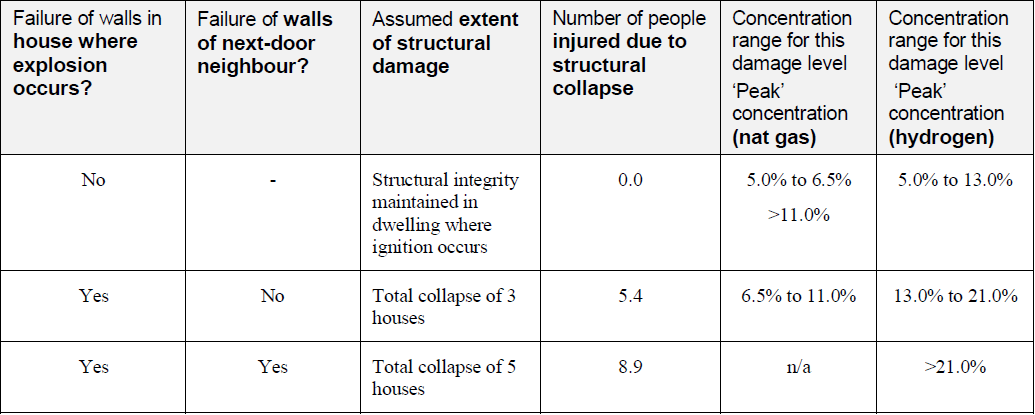
Safety Assessment Conclusions Report incorporating Quantitative Risk Assessment, Hy4Heat Workpack 7, ARUP+
People, Risk and Spaces
The key thing I want you to recognise, is that both models correlate injury to the severity of structural damage, ranging from projectiles to full collapse. The rationale for this is that the probability of injury is constrained by how many people are likely to be at risk in those spaces.
Let me put this another way with emphasis on what you need to remember as we step forward: the probability of injury in a given damage scenario is related to the severity of the damage and the number of people who are likely to be in that space; this is independent of the gas or explosive that was used to create that damage.
So staying with the modelling of natural gas injuries in the kitchen, we are given the following table, with a note attached to the third row(*):
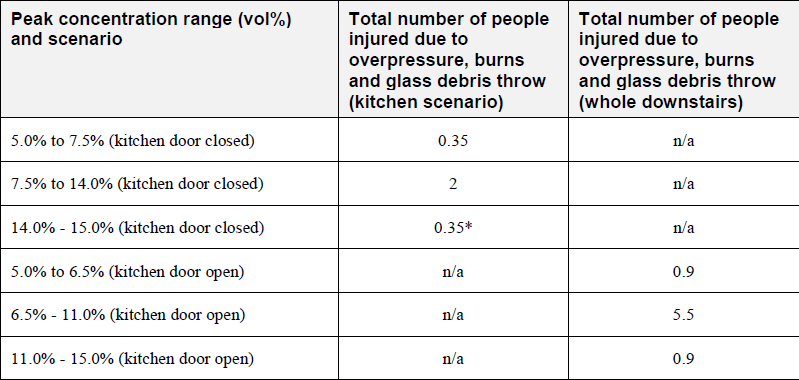
*This could be interpreted as meaning that larger leaks and greater methane inventories are less dangerous than smaller leaks with lower methane concentrations. In terms of actual injuries, this is unlikely to be the case. This result arises because the consequence modelling has assessed the level of damage and, hence, the injuries likely to occur from the primary deflagration in the originating room. In practice a large gas inventory (several kg) may well create secondary fires and explosions in adjacent rooms which will cause further damage and injury. This is an example of natural gas being assigned a cautious low risk to ensure a relative QRA with a pessimistic view of hydrogen
Safety Assessment Conclusions Report incorporating Quantitative Risk Assessment, Hy4Heat Workpack 7, ARUP+
The Table 26 note says that the number of injuries are effectively capped to those that happen within the kitchen, and disregards those that might occur in adjacent spaces or from secondary fires, explosions and projectiles. This is a reasonable assumption because it is the standard that is being adopted for all incidents behind a closed kitchen door.
So while remembering that the correlation between event and injury is made via estimates of potential structural damage, let’s also recall that from Table 24 for the kitchen scenario I said that ‘the equivalence in damage potential (partial collapse of 3 houses) between the volumetric concentrations of natural gas (7.5-14.0%) and hydrogen (14.0-23.0%)’ which probabilistically yields 2 injuries.
Unsurprisingly, in Table 26 the 7.5-14.0% (by volume) range of natural gas with the kitchen door closed, agrees with the 2 injuries indicated in Table 24. So why, in Table 27 in respect of the equivalent damage resulting from hydrogen incident (in the 14.0-23.0% range), why do the number of injuries go up to 2.3 for an equivalent structural damage event, in the same modelled space? There may be a good reason for this and I will return to the question in my own QRA review.

Safety Assessment Conclusions Report incorporating Quantitative Risk Assessment, Hy4Heat Workpack 7, ARUP+
I will come back to Table 27 but first let’s revisit the note to Table 26. It acknowledges that for natural gas the model shows a decrease in injuries for an increase in natural gas volume. To be explicit, this means that in the range of 7.5-14.0% the number of injuries is 2 but then in the higher range of 14.0-15.0% it drops dramatically to 0.35.
To quote from the note to Table 26:
This could be interpreted as meaning that larger leaks and greater methane inventories are less dangerous than smaller leaks with lower methane concentrations. In terms of actual injuries, this is unlikely to be the case.
Safety Assessment Conclusions Report incorporating Quantitative Risk Assessment, Hy4Heat Workpack 7, ARUP+
This shows an almost saintly effort by ARUP+ to give natural gas the benefit of every doubt, with the intention of course, to make sure that any comparison with hydrogen is beyond reproach. The result is comedic levels of understatement but the explanation offered is:
This result arises because the consequence modelling has assessed the level of damage and, hence, the injuries likely to occur from the primary deflagration in the originating room.
Safety Assessment Conclusions Report incorporating Quantitative Risk Assessment, Hy4Heat Workpack 7, ARUP+
I am unsure, after all, the spatial limitation applies to all the partial volumes scenarios. The only scenario I can think of where increased gas volume resulted in less incident damage would be when the flammable mixture exceeds the UEL in parts of the room, and I say 'parts' because otherwise there would not be an ignition incident at all. It seems to me that the correlation to potential structure damage is in danger of being severed by Tables 26 and 27. I will reserve judgement on that for now.
In any case, now we are ready to pay more attention to the contrasting treatment of hydrogen in Table 27, where a large increase in injuries suddenly appears. To be explicit, this means that in the range of 14.0-23.0% the number of injuries is 2.3 (sic) but then for anything over 23.0% it jumps to 7.4.
Where in does all the extra kitchen damage come from, or for that matter, extra people?
Again from the note to Table 26:
In practice a large gas inventory (several kg) may well create secondary fires and explosions in adjacent rooms which will cause further damage and injury.
Safety Assessment Conclusions Report incorporating Quantitative Risk Assessment, Hy4Heat Workpack 7, ARUP+
True, but remember that is not what we are assessing in this model, because everyone seems to be crammed into the kitchen. The note concludes with:
This is an example of natural gas being assigned a cautious low risk to ensure a relative QRA with a pessimistic view of hydrogen
Safety Assessment Conclusions Report incorporating Quantitative Risk Assessment, Hy4Heat Workpack 7, ARUP+
A popular suggestion in the comments to Mr Baxter’s regular posts on this is that ARUP+ have (paraphrasing) written the ‘report outcomes to order’. This is defamatory, derogatory and the kindest interpretation of this is that these comments come from people, who simply do not understand what they are reading.